We live in a world today, with statistics all around us. Opinion polls. Confidence Intervals. Margin of Error. Risk estimates. But do we actually understand what any of these things mean?
I must have been in college when I first heard the quote popularized by Mark Twain: “There are lies, there are damned lies, and then there are statistics.” As an engineering student with a passion for mathematics, I found myself very confused. After all, the numbers don’t lie. How can anyone be so skeptical of math & statistics?
It was only as I grew older, that I started to better appreciate the insight in that quote. It’s true that the numbers don’t lie… but our minds certainly do. You see, we all think that we understand statistics. We all think we have an intuitive feel for it. But more often than not, our intuition turns out to be completely wrong. Too often, our intuition leads us completely astray, without us even realizing it.
Don’t believe me? Well, let’s play a game and find out.
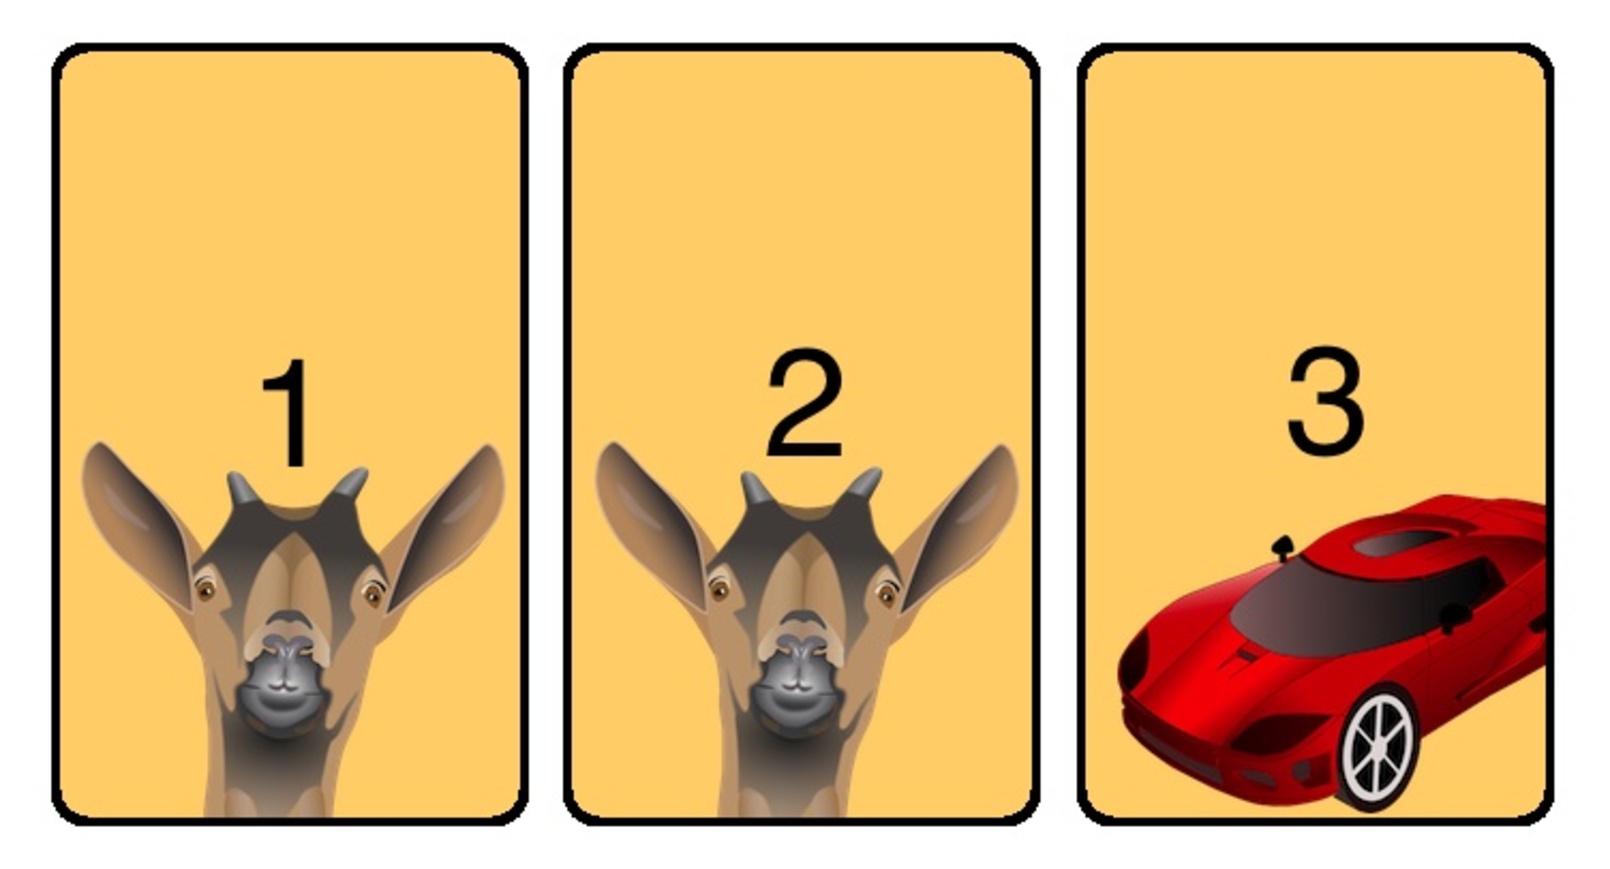
Welcome to the Monty Hall Game Show! Up for grabs, is a fancy new car that could be all yours. We have below, 3 doors. Behind one of these doors, is the car. And behind the other 2 doors, is a goat. If you guess right, the car is all yours. What’s your guess going to be?
Door 3 you say? Well, here at the Monty Hall Game Show, we want to give you the best possible odds of winning. So as a show policy, after you’ve made your guess, we will always show you one of the other 2 doors, which contains the goat. And in this case, that’s door 1:
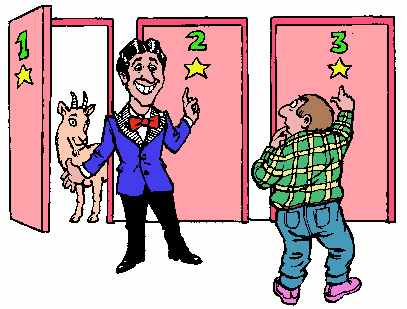
Now, you no longer have to choose between 3 doors. You only have to choose between 2. Would you like to stick to your original guess of door 3? Or would you like to change your guess to Door 2?
Now comes the million dollar question. What are your odds of winning? And does it matter whether you stick to your original guess?
Our intuition might tell us that our odds of winning are 50%, and it doesn’t matter whether or not we switch. But that intuition, would be completely wrong. And here comes the key takeaway of this entire piece: If you ever find yourself in such a situation, don’t think of it as a single event with a single outcome. Instead, ask yourself what would happen if you replayed this event 100 different times, with a different outcome each time.
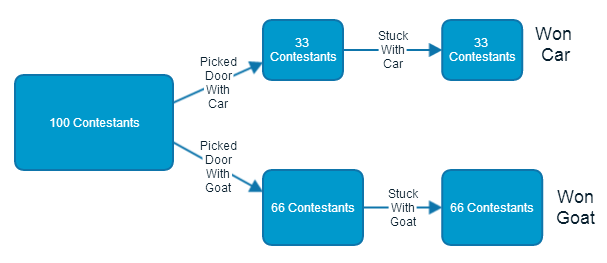
Imagine yourself playing the game 100 times, and always sticking to your original guess. 33% of the time, you will guess the right door on your very first attempt. And because you always stuck to your original guess, you will end up winning the car 33% of the time. Ironically, the fact that the host showed you one of the empty doors, doesn’t change your odds of winning at all.
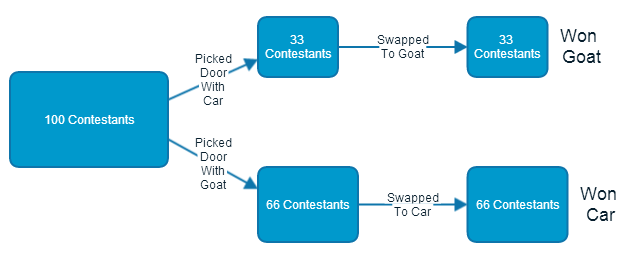
Instead, imagine yourself playing the game 100 times, and always changing your guess after the host opens one of the doors. 66% of the time, you will start off with one of the empty doors. And after the host has revealed the other empty door, your switching will result in you picking the door with the car behind it. Thus, your odds of winning actually increase all the way to 66%. At no point is your odds of winning ever going to be 50%.
Think you got the hang of it? Let’s find out. You’re now sitting next to a stranger on the bus. She turns to you & tells you that she has 2 kids. What are the odds of her having 2 boys?
This seems easy enough:
The odds of each kid being a boy is 50%, so the odds of both being boys is 25/100 = 25%, also shown when you crunch the numbers as shown above.
Now let’s add a twist. You ask her whether she has at least one boy. She says yes. Now what are the odds of her having 2 boys? Is it still 25%? Is it 50%?
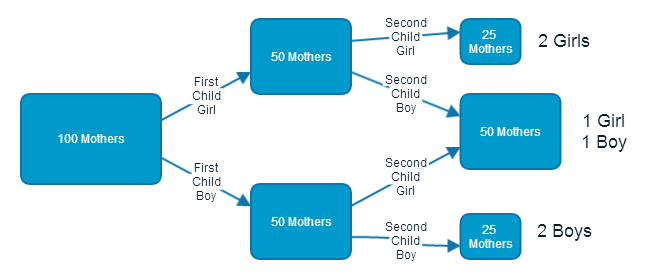
To find out, let’s go back to our previous way of tackling these problems. Imagine there being 100 mothers, all with 2 kids. And here’s how this number breaks down:
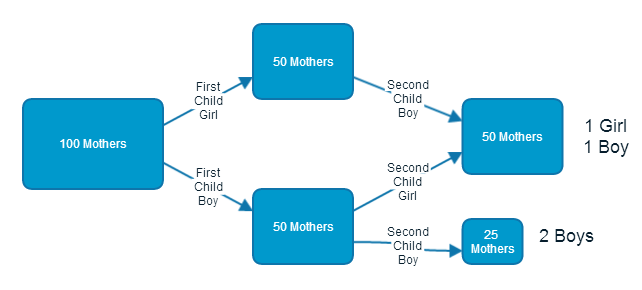
When the stranger on the bus tells you that she has a boy, all that tells you is that the very first case cannot be true. This mother does not have 2 girls. However, there are still 75 possibilities that remain, out of whom 25 have 2 boys. Hence, the odds of her having 2 boys is now 25/75 = 33%.
Keep in mind though that the context behind the information is crucial. Suppose the mother didn’t tell you she has a boy. Instead, you go to her house, knock on the door, and a boy opens the door. The numbers now break down differently:
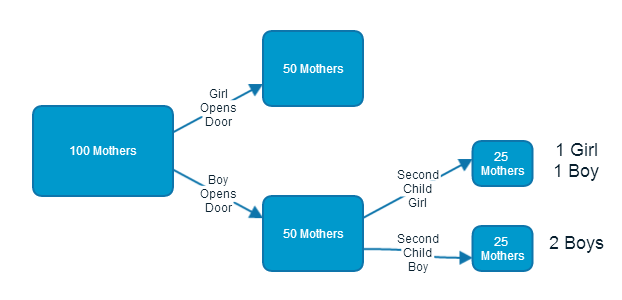
The fact that a boy opened the door, and not a girl, now leaves only 50 possibilities open. Out of which, 25 have 2 boys. So the odds of her having 2 boys is no longer 33%, it’s instead 50%. Even though this problem seems extremely similar to the previous one, the small change in the way the information is presented causes the answer to dramatically change from 33% to 50%.
Which brings us to the next key takeaway: There is no such thing is a single “absolute” probability. Rather, it constantly & dynamically changes depending on the amount of information that is available, and the precise way in which that information was obtained.
Think you got the hang of it? Let’s throw yet another twist. You’re sitting next to a stranger on a bus who tells you she has 2 kids. You ask her if she has a boy born on a Tuesday. She says yes. What are the odds of her having 2 boys?
Once again, our intuition tells us that the “born on a Tuesday” makes absolutely no difference at all. After all, he has to be born on some day of the week, and what’s the relationship between Tuesday & having 2 boys? But once again, our intuition turns out to be completely wrong.
Imagine 100 mothers once again, and how this number breaks down:
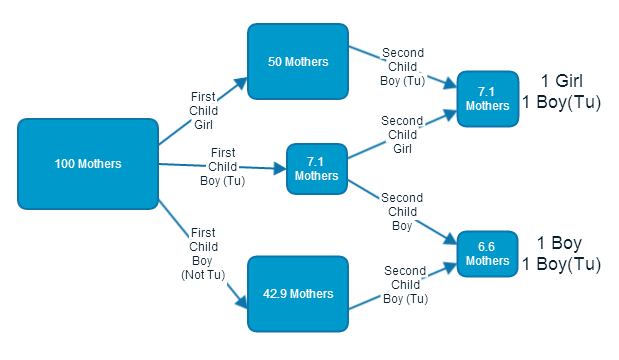
Out of the 100, only 13.7 have a boy born on Tuesday. Out of these, 6.6 mothers have 2 boys, at least one of whom is born on Tuesday. Hence, the odds of her having 2 boys has now changed from 33% to 48%. Even something as seemingly trivial as a kid’s birthday, completely changes our answer.
At this point, you may be saying to yourself that these are contrived puzzles that would never happen in real life. That’s a fair point, so let’s look at a different puzzle that’s vitally relevant to our lives.
You go to see the doctor, and he decides to test you for a rare disease called Neurophilia. A few minutes later, he comes back with grave news. You have tested positive for Neurophilia. You ask the doctor how accurate the test is, and he replies that the test is 98% accurate. What are the odds of you actually having the disease?
Our intuition might tell us that the odds of us having the disease is 98%, just like the test’s accuracy. But once again, that is completely wrong. In fact, we can’t even predict our odds of having the disease, without asking a follow-up question. “How prevalent is Neurophilia?” The doctors replies that Neurophilia is indeed pretty rare, affecting only 1% of the population. At this point, imagine again 100 different people getting tested for the disease:
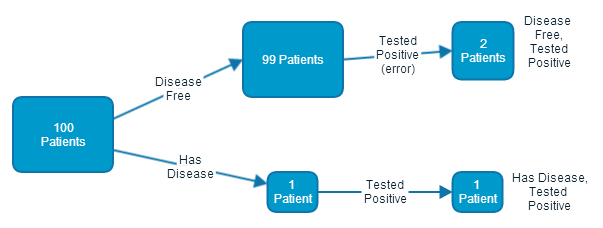
Out of the 100, only 1 actually has the disease. But because the test is only 98% accurate, 2 among the 99 who are disease-free, will wind up testing positive anyway. Thus, the odds of you actually having the disease, is only 33%. Even though the test’s 98% accuracy rate might seem so highly impressive, our actual odds of having the disease is a measly one third.
Which brings us to the second key takeaway: It’s not enough to simply test for something in a vacuum. We also need to estimate the odds of something being true, even before we get the test results back. Only by comparing our initial estimate with the test’s accuracy, can we arrive at the final answer.
To see why this is true, imagine if the doctor tells you that the 1% prevalence mentioned earlier is too optimistic. That the disease prevalence varies greatly with an individual’s circumstances, and that for someone of your age, weight & gender, the disease prevalence is actually 10%. The numbers now change completely:

Out of the imaginary 100 patients, 10 of them will now have the disease, and 2 others will test positive. The odds of you actually having the disease given that you tested positive, has now increased to 83%. If we assume that your initial odds of being diseased is 1%, the final odds of you being diseased is only 33%. But if we change our initial estimate from 1% to 10%, the final odds of you having the disease grows to 83%.
It might seem paradoxical & circular to place such importance on initial, naive estimates of someone having the disease, when we’re doing these tests precisely because we don’t know the answer. But that is the true nature of statistics. There is no “absolute right answer,” of the kind we find in other sciences & math. Our initial naive estimates will greatly influence the final answer, even though they are simply naive estimates to begin with.
Do you think you’ve now mastered the art of Statistics? Let’s find out. You’re a juror serving in a murder trial… the defendant’s life sits in your hands. The police detective testifies that some DNA fragments were gathered at the scene of the crime. The police ran this DNA on a random database of people who live in the same city, and the defendant came up as a perfect match. He goes on to state that the test is 99.9% accurate. What are the odds of the defendant being guilty?
Once again, we cannot even begin to answer this question without first forming an initial probability estimate. You ask the detective how large the city is, and he replies that there are 2 million people who live or work in the city.
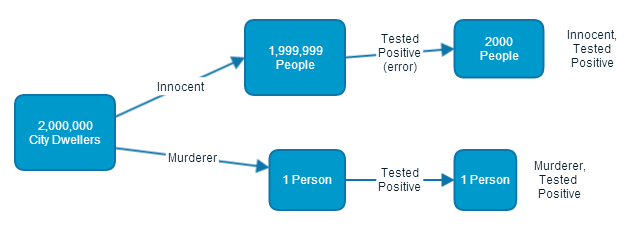
Out of these 2 million people, only 1 person is actually guilty. However, because the test is only 99.9% accurate, 2000 people will be flagged as matching the DNA, even though they are innocent. The odds of the defendant being guilty is a paltry 0.05%.
At this point, the detective interjects. He tells you that the defendant isn’t simply some random person found in the city; he actually knows the victim personally. There are only 1000 people in the city who know the victim personally.
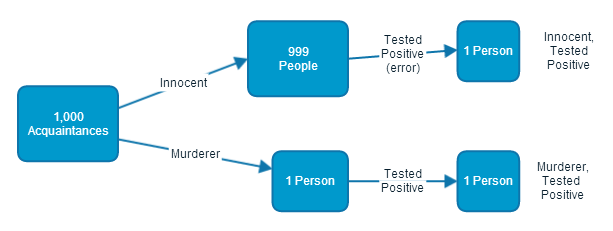
You crunch the numbers again, and find that 2 people out of the 1000 will test positive. One of whom is actually guilty, and another who was simply unlucky. Therefore, the odds of the defendant being guilty is still only 50%. Plenty of room for reasonable doubt.
Once again, the detective interjects. “No no no, you don’t understand. The defendant was born on a Tuesday. There are only 140 people who know the victim personally & were born on Tuesday. Out of these 140, only 0.14 will test falsely positive. Therefore, the odds of the defendant being guilty is actually 88%.”
“What do you mean, he was born on Tuesday? Why does that matter?” you reply.
“Remember that mother you met on the bus earlier? Well, her son being born on a Tuesday changed the answer from 33% to 48%. If that matters, then so does this.” the detective confidently states.
And if you find yourself unable to respond… if you find yourself on the verge of believing the detective’s blatant distortion… don’t feel bad. Statistics is hard. It’s confusing. And it’s downright non-intuitive. And that’s why there are lies… there are damned lies… and then there is statistics.
Related News:
Spurious correlations: Traffic Noise and Obesity
NYTimes article also discussing conditional probability, its subjective/dynamic nature, and the Monty Hall problem. What are the odds of NYTimes writing about these exact same topics a month later?

I am in fact delighted to read this webpage posts which carries
plenty of helpful information, thanks for providing these kinds of statistics.