“Returns represent past performance, are not a guarantee of future performance, and are not indicative of any specific investment.” We’ve all seen these disclaimers a million times before. Most people who are financially savvy nod along when they hear this, and think they have fully internalized this. But in truth, most haven’t.
The majority of investment advice today, even when given by financial planners and experts, essentially assumes that past returns are predictive of future performance. Search for any housing buy-vs-rent calculator, and they auto-fill the annual-investment-returns based on historical returns. Search for any retirement-savings calculator, and once again, they auto-fill the annual-investment-returns based on historical returns. The fabled 4% rule used by retirees to determine how much money they can withdraw each year? Also based purely on historical returns.
What do you think would happen if future returns differ significantly from historical returns? The advice given by all of the above would be completely wrong. You may find yourself passing up on fantastic real estate investments, undersaving for your retirement, and wind up penniless in your 80s.
“But what’s wrong with assuming that future market returns will be similar to historical returns?” you might be wondering. “These are broad market indexes, and heavily diversified. Individual stock performance may vary, and there might be a few unexpected downturns, but the market as a whole will be consistent over the long run.”
Such thinking is false and fundamentally flawed. To see why, consider the following. Imagine two houses, located in different cities, both being sold for $1M. One house is currently being rented out at its market-rate of $5,500/month. And is located in a city with projected economic growth of 3.5% per year. The second house is currently being rented out at its market-rate of $4,100/month, and is located in a city with a projected economic growth of 2% per year.
As a rental property, do you think both houses will produce the same returns?
Of course not. Only a fool would believe that “the first house produced annual returns of 10% over the past 50 years, and therefore, the second house will also produce annual returns of 10% over the next 50 years.” And yet, this is in essence what people are saying about future stock market returns as compared to historical returns.
If you think the above numbers are hypothetical and not realistic, think again. Stock market returns are ultimately driven by present and future corporate profits, just as rental property returns are ultimately driven by present and future rents. If you invested $1M in the American stock market at a random point in the 20th century, your shares would have generated monthly (corporate) profits of roughly $5,500 per month. This is derived from the PE ratios that were commonly seen in the 20th century. Today however, if you invested $1M in the S&P 500, your shares will generate a monthly (corporate) profit of only $4,100 per month.
And future prospects for economic growth aren’t any better. America averaged a real GDP growth rate of ~3.5% per year over the latter half of the 20th century. Whereas economists today are projecting the American economy to grow by only ~2% per year in the coming decades.
GDP growth rates in developing countries are indeed higher, and many American companies do operate in those countries. But the vast majority of profits in the S&P 500 are still derived from America and other developed markets, not emerging markets.
Given these realities, it is ridiculous to expect the S&P 500 to produce the same returns in the future as it did in the 20th century. And yet, this is precisely what so many financial planners and calculators are basing their advice on.
A Better Way
“Okay, so historical returns aren’t a good indicator. But what is the alternative? Renters need to figure out whether it’s better to buy a house. Workers need to figure out how much they should save each month. And retirees need to figure out how much they can safely withdraw each month. How would people make these decisions without using historical data?”
Good question. Predicting short-term returns is indeed a herculean task, because PE ratios fluctuate so much based on public sentiment. And predicting long-term returns for individual companies is equally hard, because you never know when they will be usurped by an upstart startup. However, predicting long-term returns for the market as a whole can be done far more easily and accurately.
Let’s start off with “risk-free” bonds such as treasury bills. Treasury yield curves are published every day by the government, and tell us what returns to expect over various time horizons:

For example, the above table tells us that if you bought 30-year treasury bills on March 1st 2023, and held them to maturity, you would generate annual returns of 3.97%. Conversely if you bought 1-year treasury bills, you would generate annual returns of 5.06%.
This may seem odd – why are the returns so much lower for a longer time horizon? Couldn’t you simply buy 1-year treasuries repeatedly and get higher returns that way? Not really – interest rates are high today, but are expected to drop in the future. And if/when that happens, yields for both 1-year and 30-year treasuries will drop as well. All combined, 3.97% represents the best possible estimate (at the time this was published) for risk-free returns over the next 30 years. Such yield curves are far better than historical data at predicting risk-free returns across any time-period.
Note that the above numbers, along with most other numbers below, are nominal returns. After adjusting for inflation, real returns will be even lower.
That covers “risk-free” government bonds which by definition offer lower returns. But what about more complex bond investments, such as corporate bonds and bond funds? For such funds, your best bet is to look at their SEC yield, as well as maturity and duration. For example, let’s look at the Vanguard total bond market ETF:
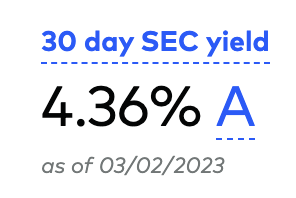
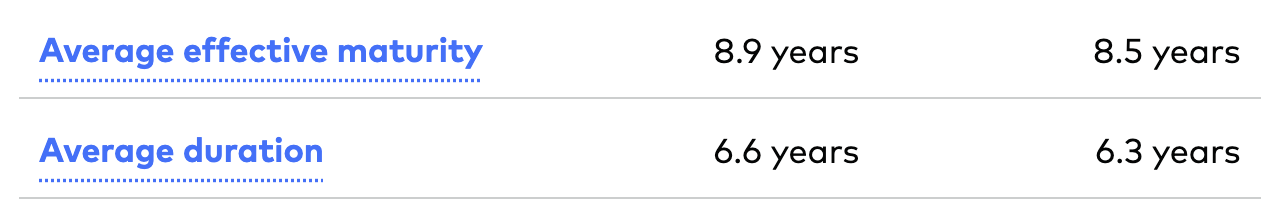
The above statistics tell us that you can expect to get returns of ~4.3% per year, over the next ~6-9 years (from the time this was published). Slightly better than investing in treasuries, but at slightly higher risk of corporations defaulting on their loans. As a general rule, the more risk you’re taking on with bonds, the higher your long-term returns would be (even after accounting for some inevitable defaults). You can use the treasury yield curve here once again, add the risk premium corresponding to the bonds you’re investing in, and use that to estimate returns for any time horizon. Once again, these approaches provide estimates not guarantees, but are far more reliable than simply looking at historical data.
So predicting bond returns was the easy part. What about equities, which are far more complex and risky? This was something I had dabbled in myself – using a combination of the PE ratio, projected GDP growth rates, and the government’s inflation target, in order to predict long-term equity returns. If you’re as much of a finance nerd as I am, you might enjoy playing with such models yourself. For most people though, you’re probably better off using projections from leading investment firms. For example, Vanguard’s annual economic and market outlook which predicts:
U.S. and international bonds to return 4%–5% per year over the next decade
10-year annualized returns for non-U.S. developed markets (7.2%–9.2%) … emerging markets (7%–9%) … U.S. markets (4.7%–6.7%)
The fact that these projections are coming from the leading proponents of passive investing should hopefully convince you that such predictions have nothing to do with stock picking or market timing. And that forward looking projections, while certainly not perfect, are far preferable to blindly assuming that history will repeat itself.
To put a spin on the popular saying: When the facts change, I change my estimates. What do you do?
Disclaimer: All estimates given above are based on market conditions at the time this was published. If there’s one takeaway from this article, don’t assume those numbers will always hold true. Instead, use the process described above to figure out the latest estimates.
Related links:
What drives Stock Market Returns?
Correlation between Stock-Market-Returns, GDP Growth and PE Ratios
